
The Progress Bar Lies
Progress bars look precise, but the percentages aren't always what they seem. A look at how software uses progress indicators to communicate status, manage expectations, and quietly shape what we trust.

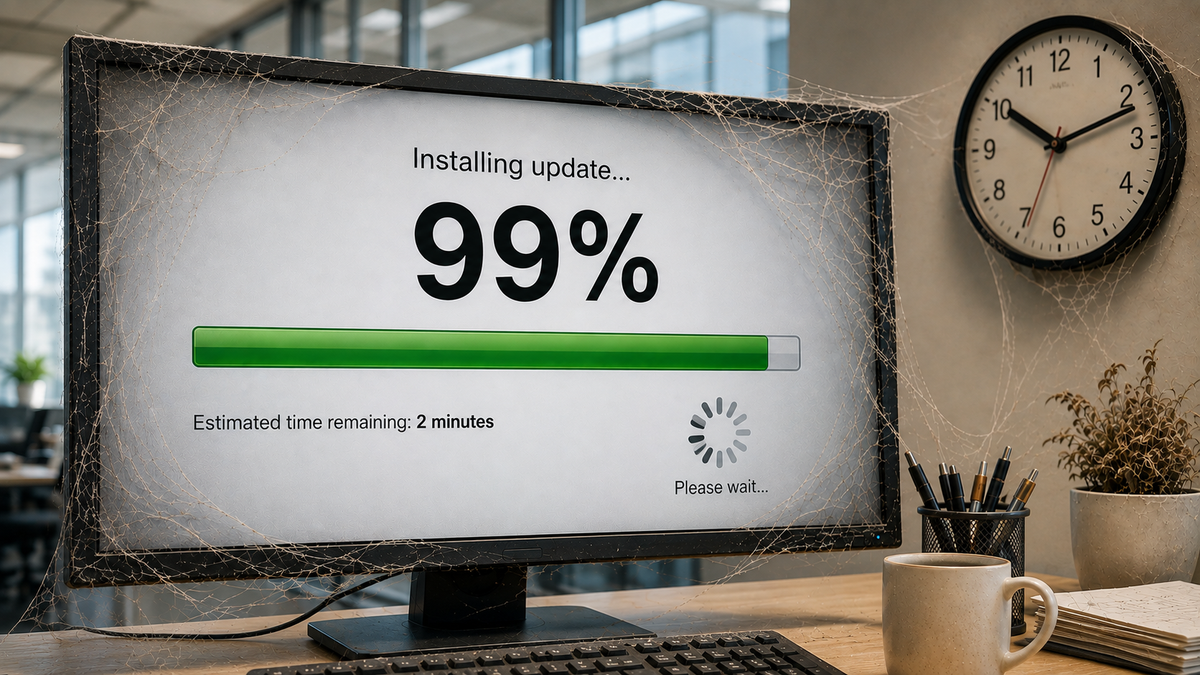
Liar, liar, pants on fire.
by Jana Diamond, PMP
A progress bar looks like a measurement.
Sometimes it's closer to reassurance.
You've seen this before.
You're installing something.
12% . . . 27% . . . 54% . . . 84% . . . 32% . . .
Wait.
What?!
Apparently, percentages are more of a vibe.
Or maybe you get the other version.
12% . . . 27% . . . 54% . . . looking good.
82%.
94%.
99%.
And there it sits.
Five minutes later, still 99%.
Now you're wondering whether it's frozen, whether you should cancel it, whether canceling it will break something, and whether you've made terrible life choices.
Then - voilà!
Complete.
Or maybe you don't even get a progress bar.
You get the spinner.
Round and round it goes, communicating precisely one thing:
Something may or may not be happening. Please enjoy this circle.
No percentage. No estimate. No clue whether you're waiting for another three seconds or should go make a sandwich.
And yet, as long as that little thing keeps spinning, most of us wait. And stare at it, like it’s the most precious baby we’ve ever seen.
Because movement looks like progress.
And of course, we've all seen the equally ridiculous cousin:
2% → 3% → COMPLETE
Yep. Definitely a vibe.
What Is That Bar Actually Measuring?
Sometimes, quite a lot.
A progress indicator can be tied to measurable units of work: files transferred, records processed, bytes downloaded, steps completed.
That’s fine and dandy when the work can actually be measured that way.
But plenty of processes don’t divide themselves neatly into 100 equal little pieces.
One step might take half a second. The next might take four minutes. The software may know which stage it’s in without knowing how long that stage will take. It may know that six tasks are finished and one remains, but that last task happens to be the monster hiding under the bed.
So the interface estimates.
Sometimes it smooths the movement so the bar doesn’t jerk around.
Sometimes it keeps an animation moving because a motionless screen looks suspiciously like a frozen one.
And sometimes the percentage you see is only loosely connected to how much time or work actually remains.
Which means the progress bar may be communicating two different things that look like one thing:
System status: Something is still happening.
Estimated progress: Here’s roughly how far along we think we are.
Those aren’t the same claim.
Why Does It Look So Precise?
Because it has a number.
99% feels specific.
If the screen said:
Probably almost done. Hang tight.
We’d understand immediately that we’re looking at an estimate.
But 99% looks measured. Accurate. Trustworthy.
Add a nice green bar filled almost to the edge and it looks downright scientific.
The interface gives us precision, so we assume something precise must exist behind it.
Maybe it does.
Maybe it doesn’t.
The number alone can’t tell us.
The World’s Smallest Pretty Dashboard
And that’s where the humble little progress bar starts looking suspiciously familiar.
We do the same thing with dashboards, project completion percentages, analytics, AI confidence scores, system health indicators, and plenty of other numbers software puts in front of us.
We see the number.
We see the polished interface around the number.
And somewhere along the way, we quietly upgrade displayed to measured.
That’s a problem.
Because an interface can tell us what a system wants to communicate without telling us how that information was produced.
The progress bar is basically the world’s smallest pretty dashboard.
Most of the time, that’s perfectly fine. Its job isn’t necessarily to provide a forensic accounting of every operation happening behind the scenes. Sometimes its job is simply to tell us the computer hasn’t wandered off for coffee.
But we should know the difference.
A number displayed by software isn’t automatically a measurement.
A percentage isn’t automatically precise.
And a green bar isn’t evidence just because it looks reassuringly official.
Sometimes 99% really does mean 99% of the work is finished.
And sometimes it means:
“Still working. Please don’t touch anything.”
Originally published on Protovate.AI
Protovate builds practical AI-powered software for complex, real-world environments. Led by Brian Pollack and a global team with more than 30 years of experience, Protovate helps organizations innovate responsibly, improve efficiency, and turn emerging technology into solutions that deliver measurable impact.
Over the decades, the Protovate team has worked with organizations including NASA, Johnson & Johnson, Microsoft, Walmart, Covidien, Singtel, LG, Yahoo, and Lowe’s.
About the Author

Share article


